Paving (tiling) examples#
In this tutorial, we will see how to generate tiling using rectangles, triangles and hexagons. We will also play with anisotropy and angles.
Start by importing the required modules
[1]:
from typing import Union

import matplotlib.pyplot as plt
import nested_grid_plotter as ngp
import quickpaver
import shapely
from shapely.plotting import plot_polygon
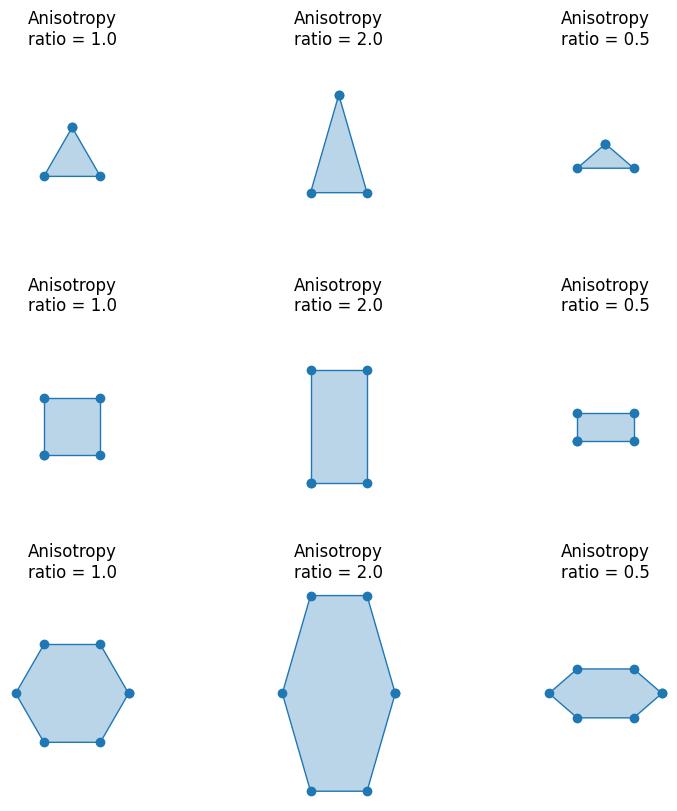
There is a choice between three shapes: triangle, rectangle, and hexagon. By default, the shapes are regular: the triangle is equilateral, the rectangle is a square, and the hexagon is not distorted. The anisotropy allows the shape to be stretched or shortened along the y-axis.
[2]:
def make_polygons():
    plotter = ngp.Plotter(
        plt.figure(figsize=(8, 8), constrained_layout=True),
        builder=ngp.SubplotsMosaicBuilder(
            mosaic=[[f"ax{i}-{j}" for j in range(3)] for i in range(3)],
            sharex=True,
            sharey=True,
        ),
    )

    for i, poly_type in enumerate(quickpaver.PolygonType.to_list()):
        for j, anisotropy_ratio in enumerate([1.0, 2.0, 0.5]):
            ax = plotter.ax_dict[f"ax{i}-{j}"]
            plot_polygon(
                quickpaver.gen_polygon(
                    poly_type.value,
                    edge_length=30.0,
                    anisotropy_ratio=anisotropy_ratio,
                ),
                ax=ax,
            )
            ngp.hide_axis_spine(ax, loc="all")
            ax.set_aspect("equal")
            ngp.hide_axis_ticklabels(ax)
            ax.set_title(f"Anisotropy\nratio = {anisotropy_ratio:.1f}")
    return plotter.fig
[3]:
make_polygons()
[3]:

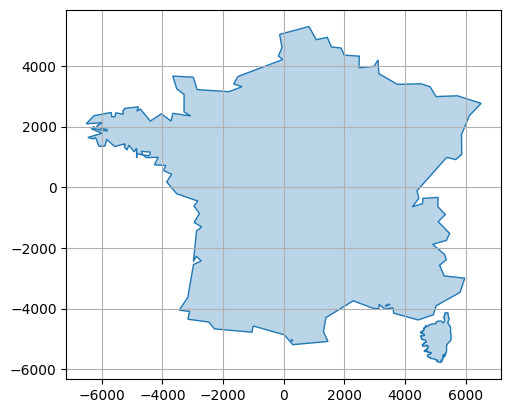
Now let’s take an example and load a simplified outline of France and Corsica.
[4]:
corsica = quickpaver.load_corsica_contour()
france = quickpaver.load_france_contour()
france_and_corsica = quickpaver.load_france_and_corsica_contour()
plot_polygon(france_and_corsica, add_points=False)
[4]:
<matplotlib.patches.PathPatch at 0x79a88f9a09d0>
Define a helper function to plot the results
[5]:
def plot_helper(
    grid: shapely.MultiPolygon,
    surface_to_cover: Union[shapely.Polygon, shapely.MultiPolygon],
):
    plotter = ngp.Plotter()
    ax = plotter.axes[0]
    plot_polygon(surface_to_cover, ax=ax, add_points=False, color="r")
    plot_polygon(
        grid,
        ax=ax,
        add_points=False,
    )
    ax.set_aspect("equal")
    plotter.close()
    return plotter.fig
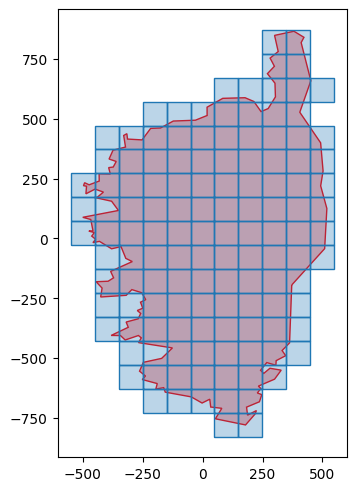
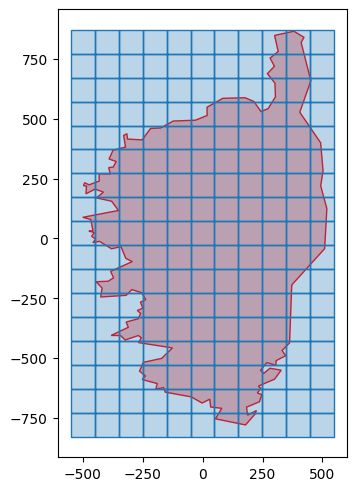
Start with a square tiling, without rotation and no anisotropy. We can see that only the meshes intersecting the surface to be covered are retained.
[6]:
grid_squares_corsica_no_rot_no_ani, _adj = quickpaver.gen_polygonal_tiling(
    corsica,
    poly_type=quickpaver.PolygonType.RECTANGLE,
    edge_length=100.0,
    anisotropy_ratio=1.0,
    rot_deg=0.0,
)
plot_helper(grid_squares_corsica_no_rot_no_ani, corsica)
[6]:
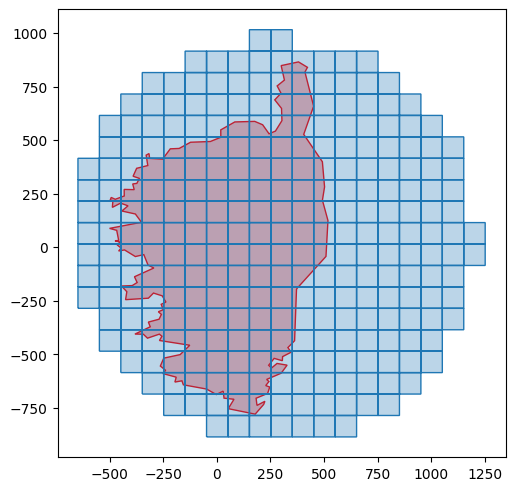
To obtain extended coverage, you simply need to modify the working domain. For example, you can choose the minimum bounding ball:
[7]:
grid_squares_corsica_circle, _adj = quickpaver.gen_polygonal_tiling(
    shapely.minimum_bounding_circle(corsica).buffer(50.0),
    poly_type=quickpaver.PolygonType.RECTANGLE,
    edge_length=100.0,
    anisotropy_ratio=1.0,
    rot_deg=0.0,
)
plot_helper(grid_squares_corsica_circle, corsica)
[7]:
Or using the bounding box
[8]:
grid_squares_corsica_rectangle, _adj = quickpaver.gen_polygonal_tiling(
    shapely.box(*corsica.bounds),
    poly_type=quickpaver.PolygonType.RECTANGLE,
    edge_length=100.0,
    anisotropy_ratio=1.0,
    rot_deg=0.0,
)
plot_helper(grid_squares_corsica_rectangle, corsica)
[8]:
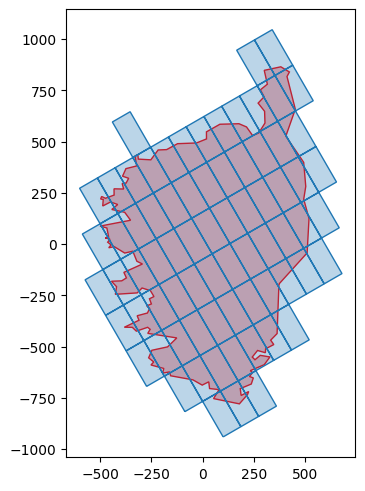
Now, let’s try with anisotropy and rotation (it goes clockwise)
[9]:
grid_squares_corsica_rot_ani, _adj = quickpaver.gen_polygonal_tiling(
    corsica,
    poly_type=quickpaver.PolygonType.RECTANGLE,
    edge_length=100.0,
    anisotropy_ratio=2.0,
    rot_deg=30.0,
)
plot_helper(grid_squares_corsica_rot_ani, corsica)
[9]:
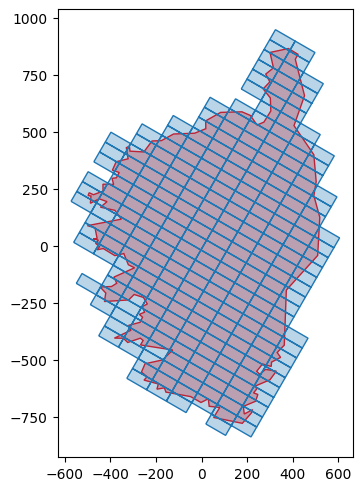
Let’s try again with different parameters
[10]:
grid_squares_corsica_rot_ani2, _adj = quickpaver.gen_polygonal_tiling(
    corsica,
    poly_type=quickpaver.PolygonType.RECTANGLE,
    edge_length=100.0,
    anisotropy_ratio=0.5,
    rot_deg=-30.0,
)
plot_helper(grid_squares_corsica_rot_ani2, corsica)
[10]:
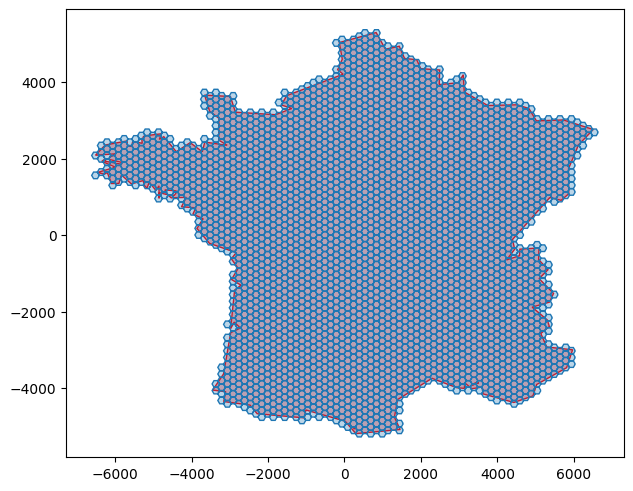
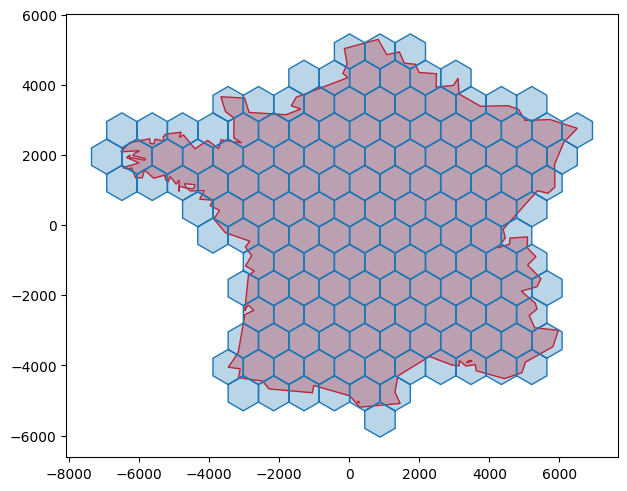
As previously introduced, hexagonal grids are also supported. Let’s now play with France outline:
[11]:
grid_hexagons_france_no_rot_no_ani, _adj = quickpaver.gen_polygonal_tiling(
    france,
    poly_type=quickpaver.PolygonType.HEXAGON,
    edge_length=100.0,
    anisotropy_ratio=1.0,
    rot_deg=0.0,
)
plot_helper(grid_hexagons_france_no_rot_no_ani, france)
[11]:
By default the hexagons are “flat-top” oriented, but it is very easily changed:
[12]:
grid_hexagons_france_rot, _adj = quickpaver.gen_polygonal_tiling(
    france,
    poly_type=quickpaver.PolygonType.HEXAGON,
    edge_length=500.0,
    anisotropy_ratio=1.0,
    rot_deg=30.0,
)
plot_helper(grid_hexagons_france_rot, france)
[12]:
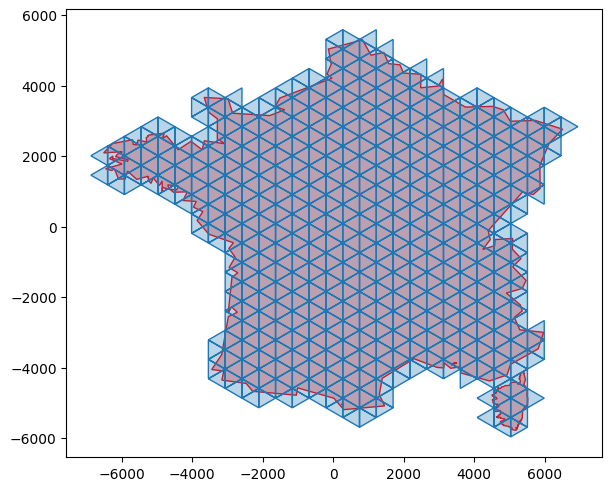
Now let’s try with triangles
[13]:
grid_triangles_rot_no_ani, _adj = quickpaver.gen_polygonal_tiling(
    france_and_corsica,
    poly_type=quickpaver.PolygonType.TRIANGLE,
    edge_length=550.0,
    anisotropy_ratio=1.0,
    rot_deg=-30.0,
)
plot_helper(grid_triangles_rot_no_ani, france_and_corsica)
[13]:
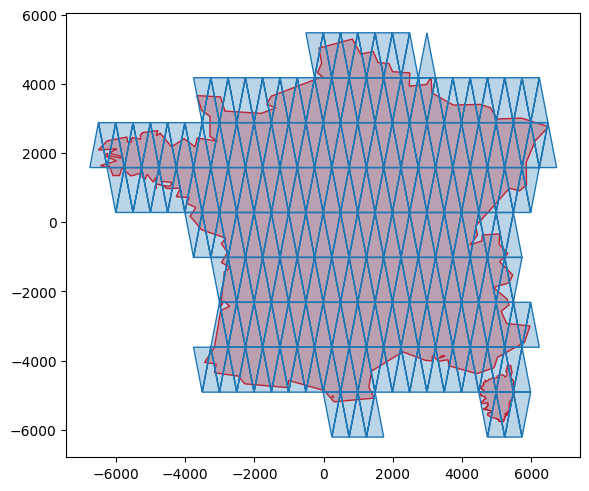
Same with anisotropy:
[14]:
grid_triangles_no_rot_ani, _adj = quickpaver.gen_polygonal_tiling(
    france_and_corsica,
    poly_type=quickpaver.PolygonType.TRIANGLE,
    edge_length=500.0,
    anisotropy_ratio=3.0,
    rot_deg=0.0,
)
plot_helper(grid_triangles_no_rot_ani, france_and_corsica)
[14]:
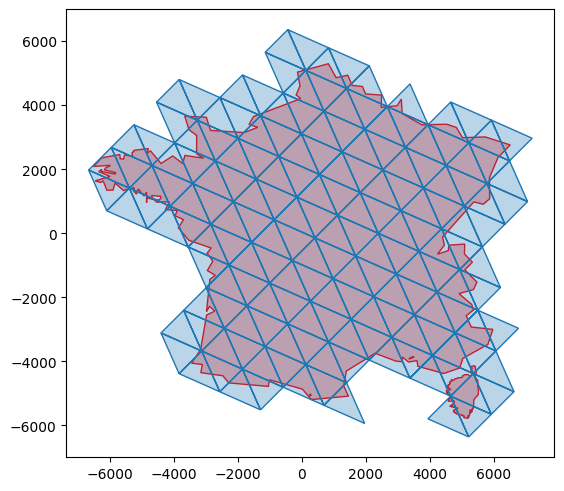
[15]:
grid_triangles_rot_ani, _adj = quickpaver.gen_polygonal_tiling(
    france_and_corsica,
    poly_type=quickpaver.PolygonType.TRIANGLE,
    edge_length=1000.0,
    anisotropy_ratio=1.5,
    rot_deg=45.0,
)
plot_helper(grid_triangles_rot_ani, france_and_corsica)
[15]:
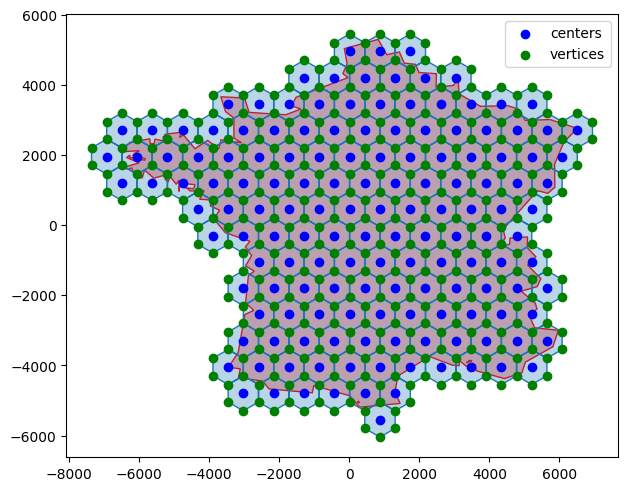
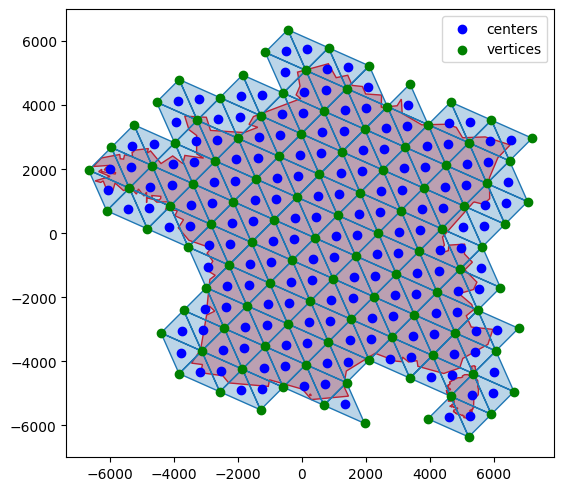
It is also possible to extract both centers and vertices (the adjacency between the vertices and the centers is also provided)
[16]:
centers = quickpaver.extract_tiling_centers(grid_hexagons_france_rot.geoms)
vertices, v_c_adj, clusters_2 = quickpaver.extract_tiling_vertices(
    grid_hexagons_france_rot.geoms
)

plotter2 = plot_helper(grid_hexagons_france_rot, france)
plotter2.axes[0].scatter(centers[:, 0], centers[:, 1], color="b", label="centers")
plotter2.axes[0].scatter(vertices[:, 0], vertices[:, 1], color="g", label="vertices")
plotter2.axes[0].legend()
plotter2
[16]:
[17]:
centers2 = quickpaver.extract_tiling_centers(grid_triangles_rot_ani.geoms)
vertices2, v_c_adj2, clusters_3 = quickpaver.extract_tiling_vertices(
    grid_triangles_rot_ani.geoms
)

plotter3 = plot_helper(grid_triangles_rot_ani, france_and_corsica)
plotter3.axes[0].scatter(centers2[:, 0], centers2[:, 1], color="b", label="centers")
plotter3.axes[0].scatter(vertices2[:, 0], vertices2[:, 1], color="g", label="vertices")
plotter3.axes[0].legend()
plotter3
[17]:
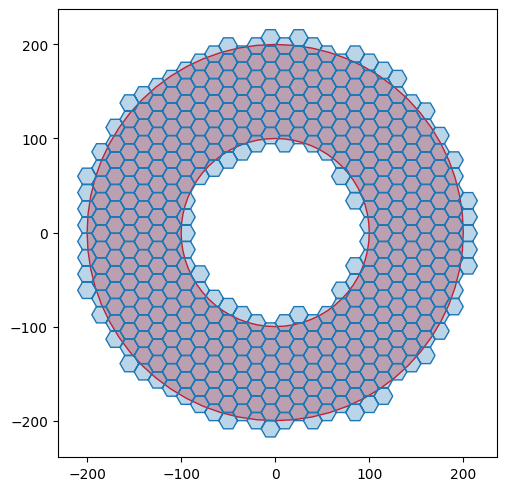
Of course, it works with holes
[18]:
donut = shapely.Point((0.0, 0.0)).buffer(200.0) - shapely.Point((0.0, 0.0)).buffer(
    100.0
)

grid_hex_donut, _adj = quickpaver.gen_polygonal_tiling(
    donut,
    poly_type=quickpaver.PolygonType.HEXAGON,
    edge_length=10.0,
    anisotropy_ratio=1.0,
    rot_deg=0.0,
)
plot_helper(grid_hex_donut, donut)
[18]:
Export to shapefile#
It is sometimes convenient to export to shapefiles.
TODO.